This blog post is a sequel to an earlier post documenting the CF Routing team’s journey to benchmark routing performance in Cloud Foundry. In this post, we will cover the highlights of our efforts to improve the performance of GoRouter, the L7 HTTP router for Cloud Foundry.
Throughout this process, we learned a lot about performance testing and design patterns for improved performance. Overall, we succeeded in improving GoRouter’s throughput by 3x in certain conditions, but not all investigations were fruitful.
Here’s what we’ll cover:
- Tooling
- Identifying Bottlenecks with GoRouter
- GoRouter Performance Improvements
- Opportunities for Future Performance Gains
- Conclusion
Tooling
We used headroom plots to understand the current state of performance and to measure potential improvements. We had the opportunity to speak with Adrian Cockroft and learn about his headroom plot tooling for visualizing performance.
In order to collect the right data, we created throughputramp, which is load generating software where the concurrency of requests is gradually increased while GoRouter response time data is collected. Very quickly, we realized that we wanted to be able to infer more results from the data, including the ability to visualize multiple runs, as well as seeing CPU information.
With inspiration from the original headroom plot, we decided to use python and Jupyter Notebook tooling to create reports that display graphs comparing two sets of data from running throughputramp on GoRouter. With this interactive notebook, visualizing performance gains and losses became much easier to prove and discern. One of these reports is attached to the release notes for Routing Release 0.144.0 which show the improvements that are discussed in this blog post.
Identifying Bottlenecks with GoRouter
After determining our performance baselines and goals, we attempted to identify performance bottlenecks.
Referring to different resources/blog posts, we effectively understood the results of pprof and focused our efforts on reducing CPU load and improving garbage collection (GC) time.
These were the pprof results of GoRouter at the time of our exploration:
$ go tool pprof --seconds=60 http://localhost:8080/debug/pprof/profile

Fetching profile from http://localhost:8080/debug/pprof/profile?seconds=60
Please wait... (1m0s)
Entering interactive mode (type "help" for commands)
(pprof) top
41.50s of 85.59s total (48.49%)
Dropped 668 nodes (cum <= 0.43s)
Showing top 10 nodes out of 266 (cum >= 1.18s)

      flat  flat%   sum%        cum   cum%
    12.38s 14.46% 14.46%     19.84s 23.18%  runtime.scanobject
     6.42s  7.50% 21.97%      6.78s  7.92%  syscall.Syscall6
     5.67s  6.62% 28.59%      6.21s  7.26%  syscall.Syscall
     3.91s  4.57% 33.16%      3.91s  4.57%  runtime.heapBitsForObject
     3.45s  4.03% 37.19%      3.45s  4.03%  runtime._ExternalCode
     2.53s  2.96% 40.14%      2.53s  2.96%  runtime.futex
     2.50s  2.92% 43.07%     18.77s 21.93%  runtime.mallocgc
     2.23s  2.61% 45.67%      3.63s  4.24%  runtime.greyobject
     1.24s  1.45% 47.12%      1.24s  1.45%  runtime.epollwait
     1.17s  1.37% 48.49%      1.18s  1.38%  runtime.heapBitsSetType
Garbage Collection
Looking at our pprof results, we noticed processes related to garbage collection like `runtime.scanobject`, `runtime.futex`, and `runtime.mallocgc` were highest CPU consuming processes over the period of sampling during our performance test and continuously appeared on the top. The fact that `runtime.scanobject` consistently came up as the top node in our pprof profile implies that there are too many allocations are being marked for scanning in our source code. For more information on how to profile Golang programs, we recommend reading this blog post. Although our efforts to tackle the memory allocation problem did not yield fruitful results, we plan to revisit this issue later. The tooling we have developed since then allows us to see improvements in CPU utilization that we couldn’t before.
Memory Consumption
We also explored several areas where GoRouter consume excessive memory, including processing of route registration messages from NATS and emitting HTTPStartStop events to Dropsonde. To optimize memory consumption, we tested a memory pool approach to cache preallocated objects but did not see significant performance improvements. We speculate the lack of improvement was because the change does not affect the critical path of the request. Another possible reason is that these memory optimization experiments were not implemented simultaneously to see the expected impact.
Reverse Proxy
The GoRouter uses the Golang reverse proxy implementation to forward requests to backend apps. We suspected that the Golang reverse proxy API could be our biggest bottleneck when we discovered that there are more performant http libraries written in Golang; one of these is called fasthttp. We spiked on rewriting the reverse proxy in GoRouter based on fasthttp and saw huge performance improvements.
As we explored the complexity and viability of implementing a reverse proxy API using fasthttp, as the library does not include an implementation, we were concerned that adopting this library would mean reinventing what Golang provides for free. We also identified several feature gaps, such as the lack of support for HTTP server sent events and HTTP trailers, which would require additional development to reach parity. Ultimately, we concluded that we would have to fork the library to implement these features ourselves; maintaining a long-lived fork was not acceptable.
However, we still had the question, what makes fasthttp faster? After some digging, we recognized the pattern of using a pool of preallocated buffers and objects being used on the request hot path. We plan to apply this pattern to GoRouter soon and are considering applying other patterns inspired by this investigation in future refactors.
GoRouter Performance Improvements
Replaced Logging Library
Two logs are written while GoRouter is running, the access log and the GoRouter log. The access log only shows the requests that have come through the GoRouter; syslog is leveraged to write this log. The GoRouter log includes the `stdout` and `stderr` output of the GoRouter process. In our performance track, we did not make any changes to access logging and focused solely on improving GoRouter logs. For the rest of this section, we are referring to our efforts to reduce the impact on CPU of the GoRouter log only.
By design GoRouter does not emit any `info` level logs in the request’s critical path, but there are some periodic background tasks such as route pruning and deregistration for which log messages are written. We discovered that the logging library we were using created superfluous logging objects which triggers garbage collection more often than necessary. Garbage collection has a direct impact on CPU usage. To minimize the impact of logging on CPU, we wanted a library that was both more concurrent and memory efficient. After evaluating various logging libraries, the one that best suited our goals was uber-go/zap.
We noticed that zap uses patterns similar to those identified in fasthttp; using a pool of preallocated objects improves performance. The cost for switching to zap was very low and garnered a modest increase in throughput. Currently this library is only used for the GoRouter log and is not used for the access log, nor used by any other component of Routing Release.
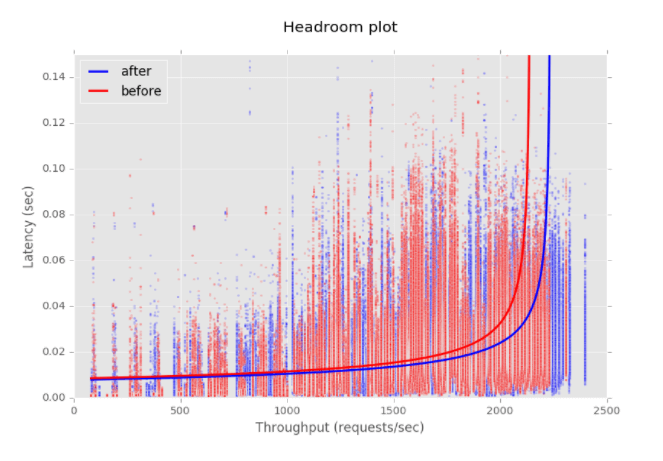
The headroom plot below shows the performance improvement from switching to uber-go/zap for logging:

Idle Keepalive Connections to Backends
Previously, GoRouter disconnected connections to backends (such as app instances and system components) after sending each HTTP request. With support for keepalive connections, GoRouter will maintain the TCP connection after sending the request and reuse the connection when the backend is selected for load balancing of subsequent requests. GoRouter will close the connection after the connection has been idle for 90 seconds. A connection is considered idle if the host does not send or receive data.
Initially we’re enabling operators to enable or disable this feature, as well as configure the maximum number of idle connections held open across all backends at any given time. As the file descriptor limit for each GoRouter process is 100,000, each connection requires two file descriptors, and to account for file descriptors used for functions other than routing, we recommend this property be set no higher than 49,000. We don’t believe there’s anything to be saved by setting the value lower, so are considering replacing the configurable value with a boolean switch. We’ve hard coded the maximum idle connections to any one backend to 100.
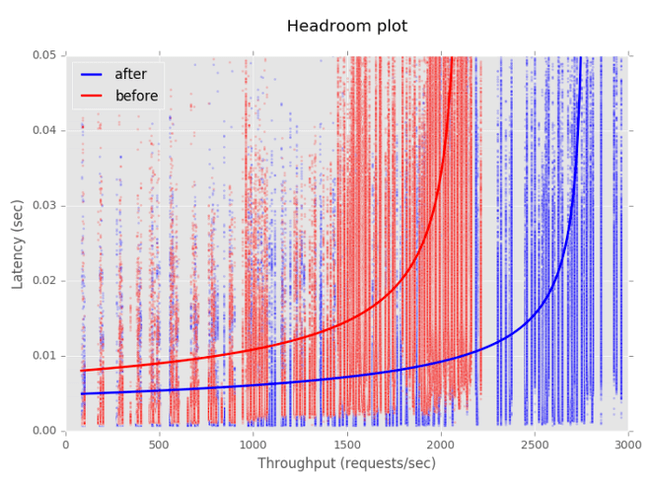
By reusing persistent connections, eliminating the overhead of closing and reopening TCP connections, we’ve seen substantial performance improvements, as demonstrated by the headroom plot below.

Use of Buffer Pools for Writing Responses
When GoRouter receives a response from a backend instance, it constructs a temporary buffer to hold the response body. When under heavy load, these temporary buffers can negatively impact performance because it allocates a significant amount of memory per response, and the Golang garbage collector spends time to clean up the temporary buffers that are left over from completed responses. We took advantage of a new feature in the Golang reverse proxy implementation that provides a buffer pool in order to allow reuse of these temporary buffers which reduces the memory allocation greatly.
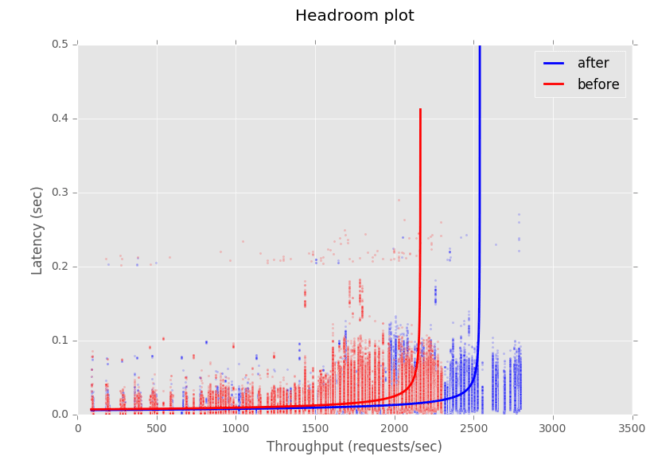
The headroom plot below shows performance improvements from reuse of buffers:

Upgraded Dependencies
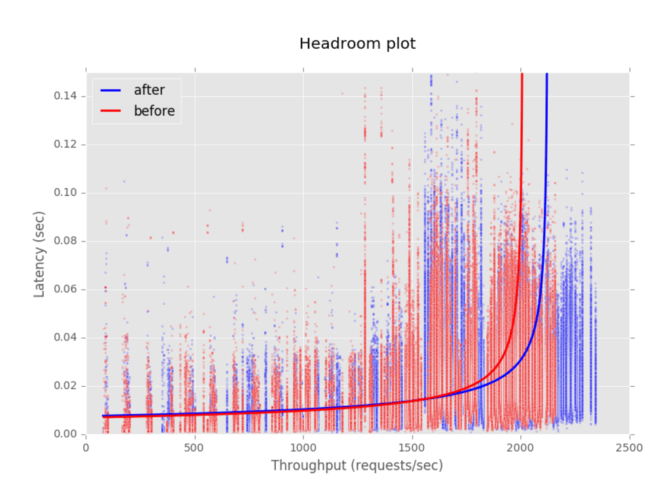
We upgraded Golang to version 1.7 from 1.6 in order to stay on supported versions of Golang, expecting the upgrade to be a performance improvement. However, we noticed a latency regression at the 99th percentile. Further investigation showed that upgrading Golang generally reduced variation of throughput and latency, but at the 99.5th percentile and higher, latency had increased. After poring over the numbers, we concluded that the upgrade is an improvement by most metrics and that the team happened to find a small percentile that degraded. See this report for deeper analysis.
Another area we looked to improve was our metrics. Currently we use the Dropsonde library to emit metrics on every request. Since these metrics are on the critical path, we looked to improve this process by moving this function to a parallel routine. However we did not see any improvement. Our biggest gains with metrics came from updating the Dropsonde library.

Opportunities for Future Performance Gains
We’ve also identified that we can achieve some performance improvements through refactoring. We plan to use the middleware library Negroni for various parts of processing client requests. At this time, GoRouter is a monolithic structure and we would like to make it more modular to improve testability. This architecture will then allow engineers to understand the code better and streamline the development process.
This change will also help expose more opportunities to apply performance optimizations using the patterns we have explored. Hopefully, this change will also enable open source developers to contribute more easily.
Conclusion
During this journey, we developed tools to prevent regressions and measure improvements. After a great deal of exploration we were able to implement a number of performance improvements in Routing Release 0.144.0, and we have identified opportunities for further performance improvements. We are now attaching performance reports with each Routing Release that compares performance with the previous release and now view performance as a first class citizen in our development process.


